| Unit | 30th FY (Consolidated) FY12/2024 |
29th FY (Consolidated) FY12/2023 |
28th FY(Consolidated) FY12/2022 |
27nd FY (Consolidated) FY12/2021 |
26st FY (Consolidated) FY12/2020 |
|
|---|---|---|---|---|---|---|
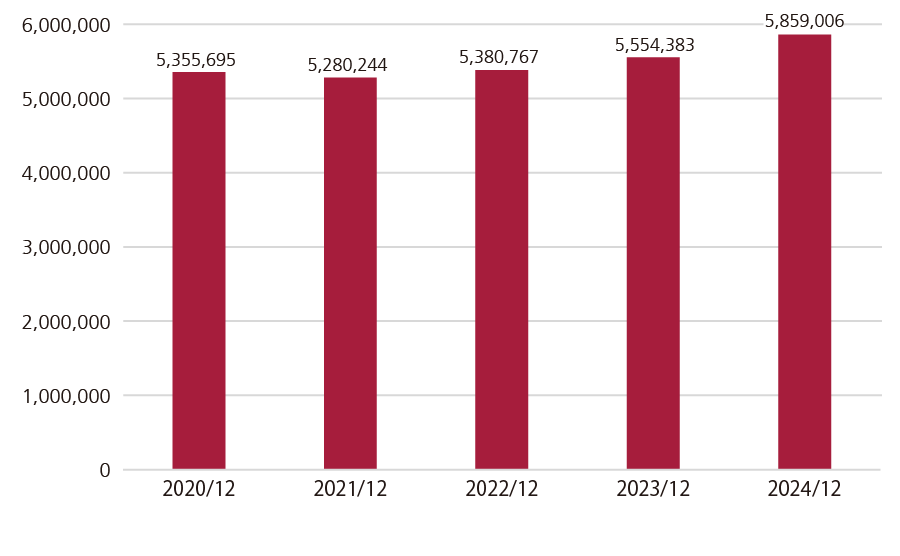
| Sales | Thousand Yen | 5,859,006 | 5,554,383 | 5,380,767 | 5,280,244 | 5,355,695 |
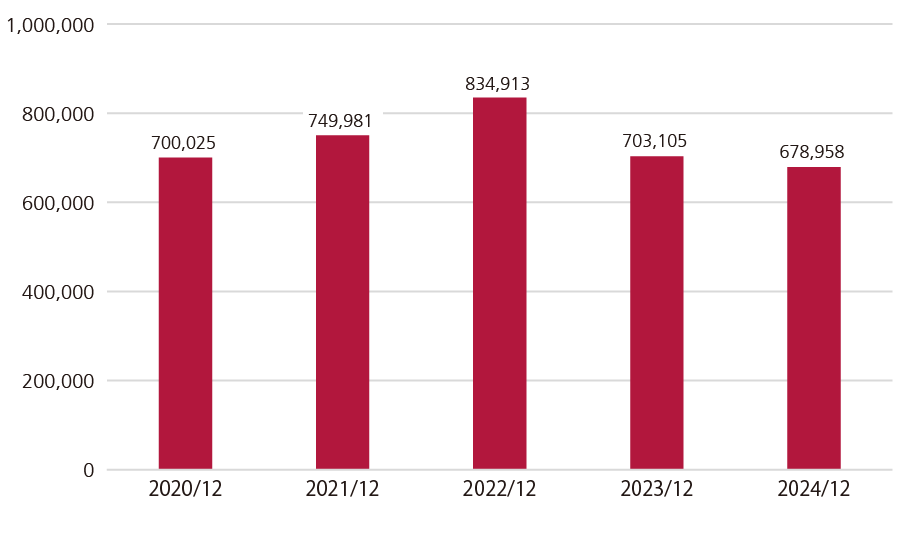
| Ordinary Profit | Thousand Yen | 678,958 | 703,105 | 834,913 | 749,981 | 700,025 |
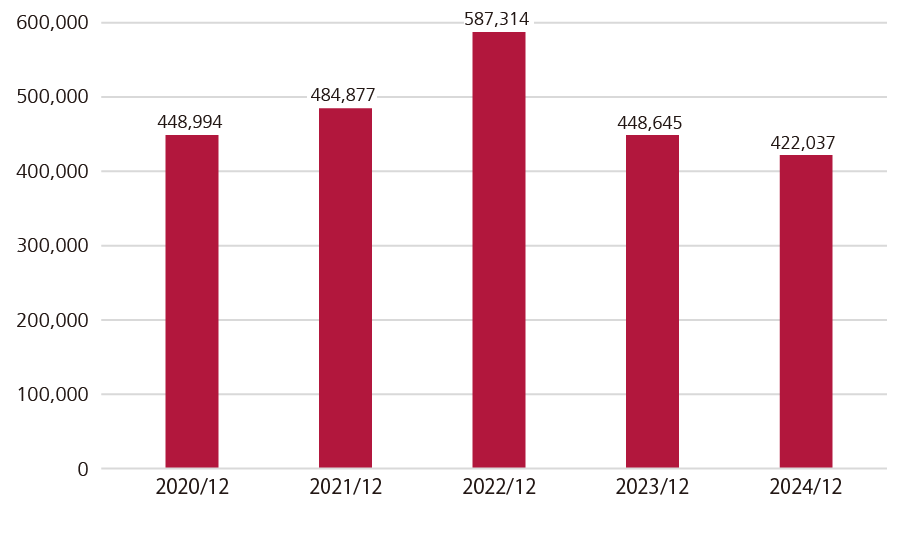
| Current Net Profit | Thousand Yen | 422,037 | 448,645 | 587,314 | 484,877 | 448,994 |
| Capital Stock | Thousand Yen | 382,510 | 382,510 | 382,510 | 382,510 | 382,510 |
| Total Number of Shares Issued | Shares | 10,242,000 | 10,242,000 | 10,242,000 | 10,242,000 | 10,242,000 |
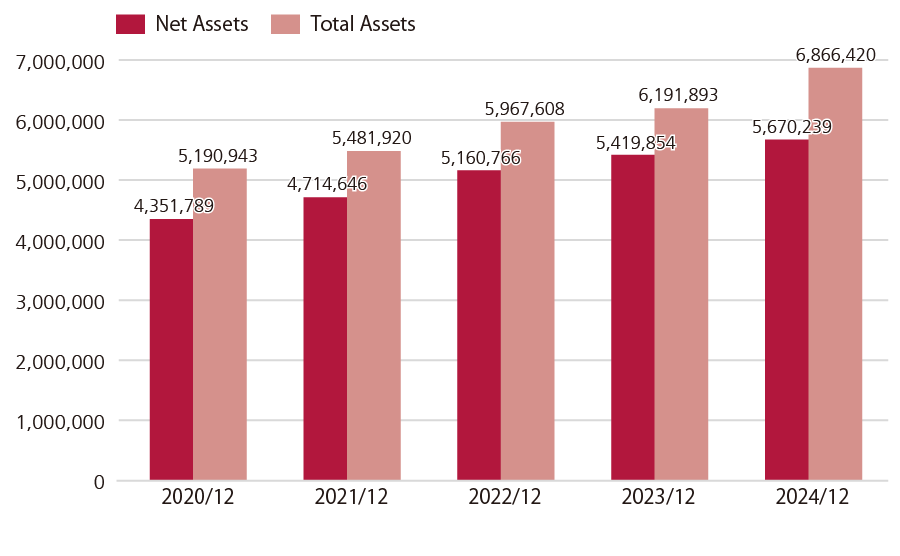
| Net Asset Amount | Thousand Yen | 5,670,239 | 5,419,854 | 5,160,766 | 4,714,646 | 4,351,789 |
| Total Asset Amount | Thousand Yen | 6,866,420 | 6,191,893 | 5,967,608 | 5,481,920 | 5,190,943 |
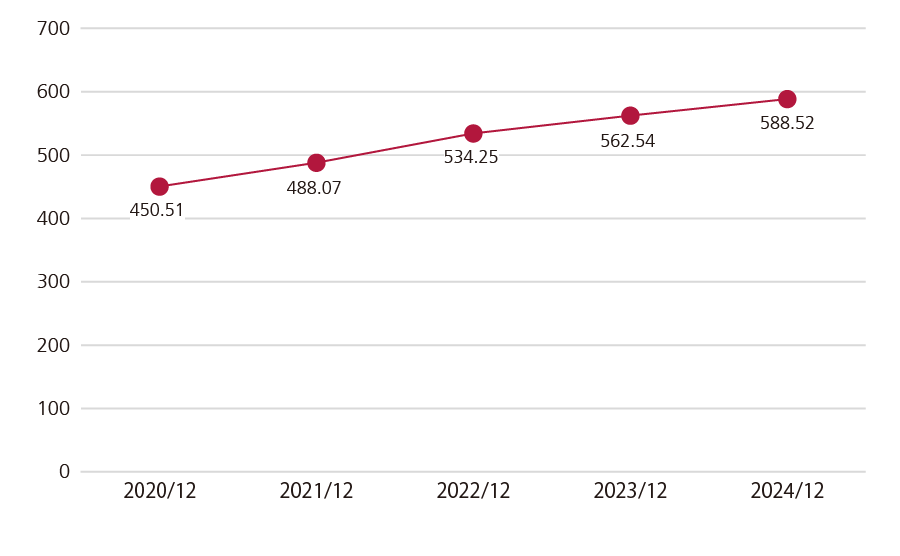
| Net Assets Per Share | Yen | 588.52 | 562.54 | 534.25 | 488 | 450.51 |
| Dividend Per Share | Yen | 19.5 | 18.5 | 18.5 | 15 | 13.5 |
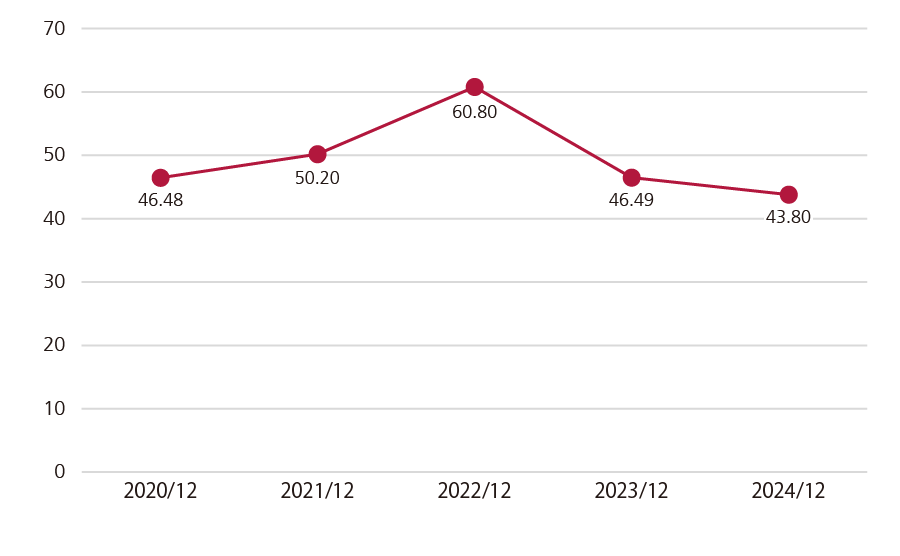
| Current Net Profit Per Share | Yen | 43.8 | 46.49 | 60.80 | 50.20 | 46.48 |
| Capital-to-Asset Ratio | % | 82.6 | 87.5 | 86.5 | 86 | 83.8 |
| Ratio of Profit to Net Worth | % | 7.6 | 8.5 | 11.9 | 8.9 | 10.7 |
| Cash Flow from Operating Activities | Thousand Yen | 582,277 | 606,403 | 760,789 | 573,207 | 610,648 |
| Cash Flow from Investing Activities | Thousand Yen | -1,043,039 | -233,126 | - 49,647 | - 49,520 | - 42,226 |
| Cash Flow from Financing Activities | Thousand Yen | -178,891 | -193,329 | - 144,895 | - 130,405 | - 173,874 |
| Balance of Cash and Cash Equivalents at the FY End | Thousand Yen | 4,431,094 | 5,070,748 | 4,890,801 | 4,324,555 | 3,931,273 |
| No. of Employees (Consolidated) | People | 293 | 211 | 204 | 201 | 200 |
![]()
PCナビOPEN
- SPナビOPEN
- CONTACT